PE/VC · Fund performance report

Your LP update, in one prompt.

Upload your fund and portfolio data. Get an LP-ready report with returns, how you compare to the benchmark, and where the money stands. All in minutes.

No credit card needed · Make a similar deck in 5 minutes

Coreworks
Growth Fund II India — LP Update
Generated in 9 min
7-8
iterations
per deck
11
data sources
combined
~9min
build time
with coreworks
13hrs
saved
each cycle
01THE DATA

Start with your
fund accounting, already in hand.

Drop in your fund and portfolio data —
no setup required.

Fund Accounting table preview
Showing 4 of 42 rows · 01_Fund_Accounting.csv

Which fields become which slide

returns+benchmarks

Key Fund Metricsthe scorecard

total commitment+unfunded

Fund Overview & Termsthe capital base

vintage+strategy+sector+investor type

Strategy & Portfoliofocus and backers

committed+called+deployed+unfunded

Capital Deploymentpacing and dry powder

returnsvsbenchmark

Net Returns vs Cambridgehow you compare

holding value+exits+cash returned

Portfolio & Cash Flowswhat's been realized

[ 02 ]THE PROMPT

One line does the
heavy lifting.

Hover each orange chip to see what
that part of the prompt does.

The prompt tells Coreworks who this report is for, what to lead with, and how to frame the returns. Here's what each part is doing.

Prompt used

Build an . It's for the — focused on returns and pacing. : 13.8% return, 1.62 value, 20% cash returned, 1.32 vs the market. . Note that — most gains aren't realized yet. Show . Keep the tone confident.

03THE INSIGHTS

It reads your data
before it builds a slide.

Each thing it spots
shapes one slide.

Coreworks looks over the combined fund accounting, portfolio, and benchmark data first. Here's what it flags — and what each flag turns into.

Key Fund Metrics slide
Signal

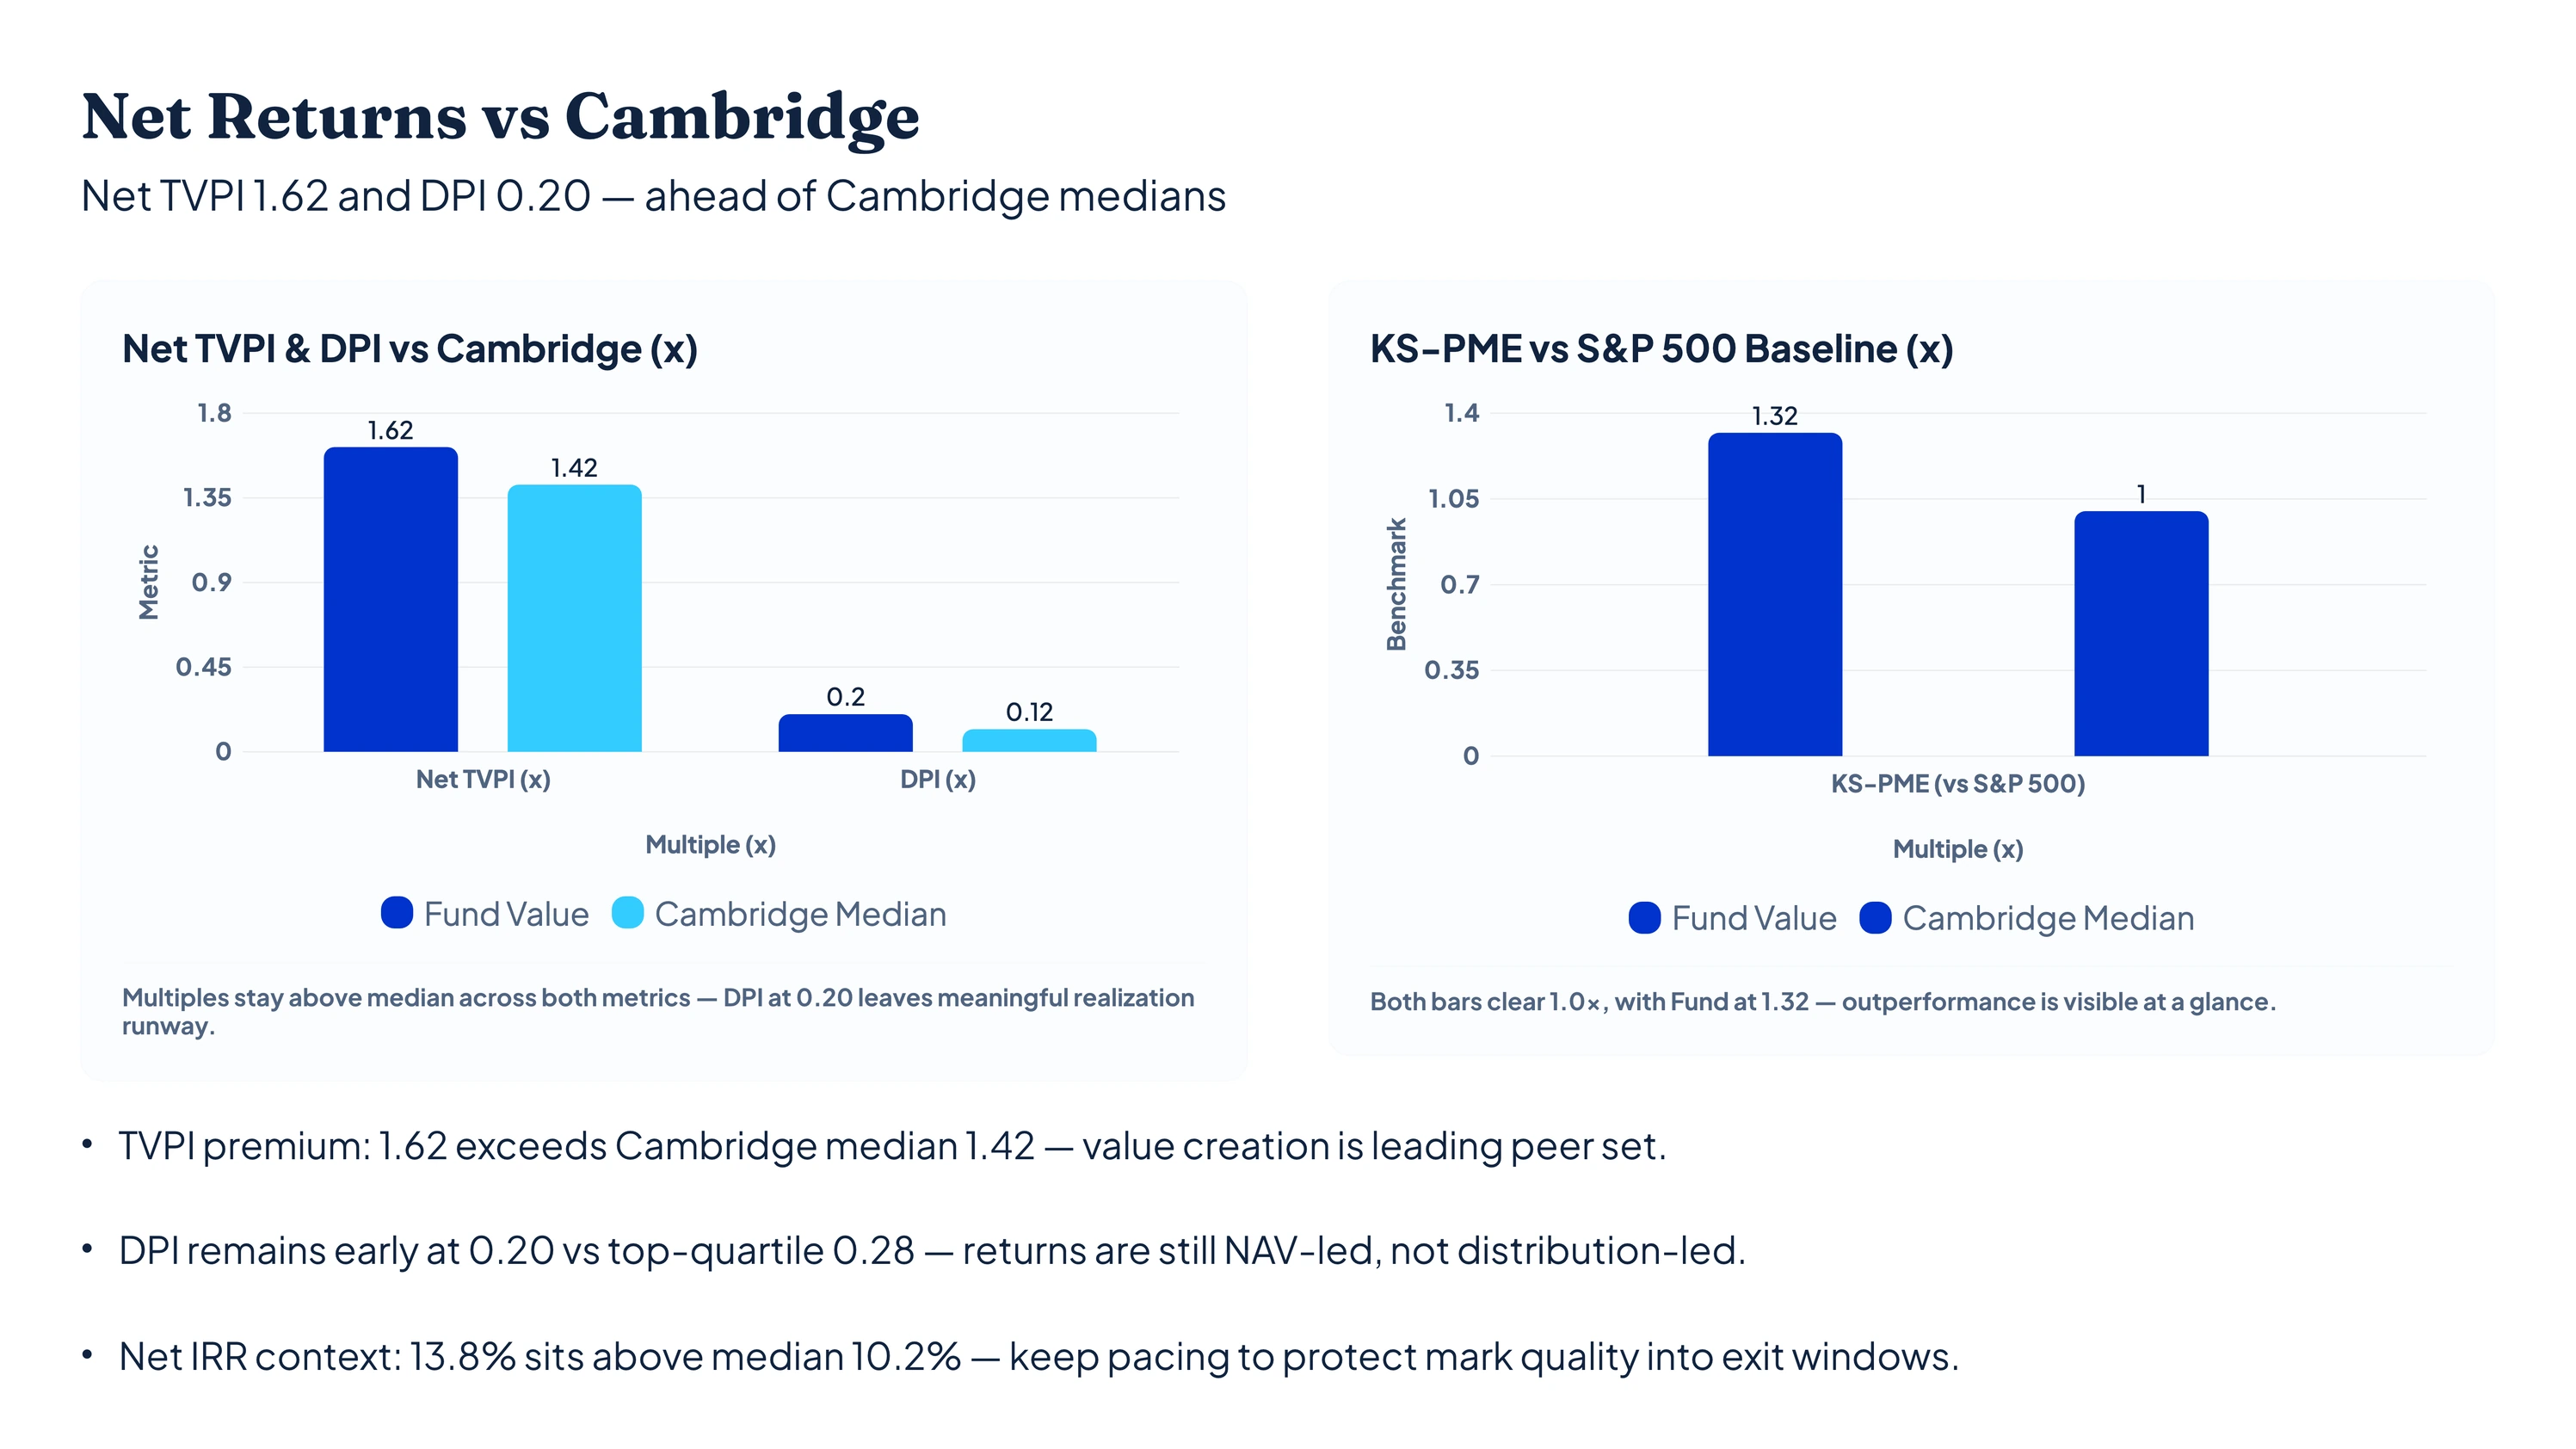
Coreworks works out each return and lines it up against the benchmark.

Every headline number clears the benchmark — 13.8% vs 10.2%, 1.62 vs 1.42, and 1.32 vs the market — so Coreworks concludes the fund is genuinely ahead, not just optically.

Creates a scorecard, with a clear “returns lead before any cash-out” framing.

Net Returns vs Cambridge slide
Risk

Coreworks compares cash returned to the benchmark and to the value still held.

Cash returned beats the benchmark (20% vs 12%) but at 0.20 trails top funds at 0.28, so Coreworks concludes most gains are still on paper, not yet realized.

Adds a cash-returned callout, framing the slide around what's still to come rather than what's banked.

Capital Deployment Status slide
Signal

Coreworks reconciles committed, called, and deployed capital.

After matching commitments to what's been called and invested, $60.5M is still uncalled — so Coreworks flags enough dry powder for 3–5 more deals.

Adds the committed-vs-called-vs-deployed chart and the pacing story through 2027.

Key Fund Metrics slide
Risk

Coreworks checks how each holding is valued.

Values lean on last-round prices for 10 companies, with one holding (NorthLoop) at $49.6M, so Coreworks flags concentration and last-round reliance as the downside to watch.

Creates a concentration/risk note, so the scorecard pairs the upside with the caveat.

04THE NARRATIVE

How the story is
designed to land.

The order
is the argument.

The prompt told Coreworks to lead with the scorecard, ground the fund, then compare returns and close on cash. Here's why that order works.

Slides 02–03

Agenda, then the scorecard.

Investors want the four headline returns — 13.8%, 1.62, 20%, 1.32 — before any structure, so the scorecard leads.

Slides 04–06

Set up the fund.

A divider opens the overview; the terms (2022 fund, $294.5M, 2/20) and the strategy and backers ground the report before returns are judged.

Slide 07

Show the pacing.

Capital deployed ($234M of $294.5M, $60.5M uncalled) sets up the dry-powder story.

Slides 08–09

Compare the returns.

A second divider turns to performance; returns sit next to the benchmark so they're read in context, not on their own.

Slide 10

End on cash.

The portfolio and cash-flows divider closes on the path from 20% cash returned toward more distributions — what investors care about next.

— ready when you are —

Build your own
Fund Report

Use the same prompt, upload your fund and portfolio data, and get an LP-ready report.

Start for free

No credit card needed · Make a similar deck in 5 minutes