Marketing · paid media performance review

Your monthly ad review, in one prompt.

Upload your Google, Meta, and LinkedIn exports. Get a clear view of spend, return, and what to scale or cut.

No credit card needed · Make a similar deck in 5 minutes

Coreworks
October Paid Media Review
Generated in 5 min
2-3
iterations
per presentation
3
ad platforms
unified
~5min
build time
with coreworks
4hrs
saved
each cycle
01THE DATA

It starts with
the exports you already pull.

Drop in your ad reports —
no setup required.

Google Ads table preview
Showing 4 of 47 rows · 01_Google_Ads.csv

How these fields drive the deck

spend+revenue+ROAS

Executive Summaryblended efficiency

actual_spendvsplanned_spend

Performance Snapshotpacing variance

campaign_type+revenue

Google AdsSearch/PMax/Shopping mix

brandvsnon-brand ROAS/CPA

Brand vs Non-Brandprotect vs discipline

audience+CPA+ROAS

Meta Performanceretargeting vs broad

campaign_type+CPL+leads

LinkedIn PerformanceMessage vs Sponsored

impressions+clicks

Funnel & Conversionproxy funnel

creative_format+objective

Creative Roundupformat gaps

[ 02 ]THE PROMPT

One line that does the
heavy lifting.

Hover the orange chips — each one
bends the deck differently.

The prompt tells Coreworks what period to cover, who to write for, and which findings to surface. Here's what each part is doing.

Prompt used

Build an across Google, Meta, and LinkedIn. Audience is the — focus on efficiency and where to scale. , then break down by channel. Call out that and that . Treat funnel data as . Tone: analytical, action-oriented.

03THE INSIGHTS

It reads your data
before it builds a slide.

Each thing it spots
shapes one slide.

Coreworks looks over your combined spend and results first. Here's what it flags — and what each flag turns into.

LinkedIn Performance slide
Anomaly

Coreworks matches spend to results for every campaign.

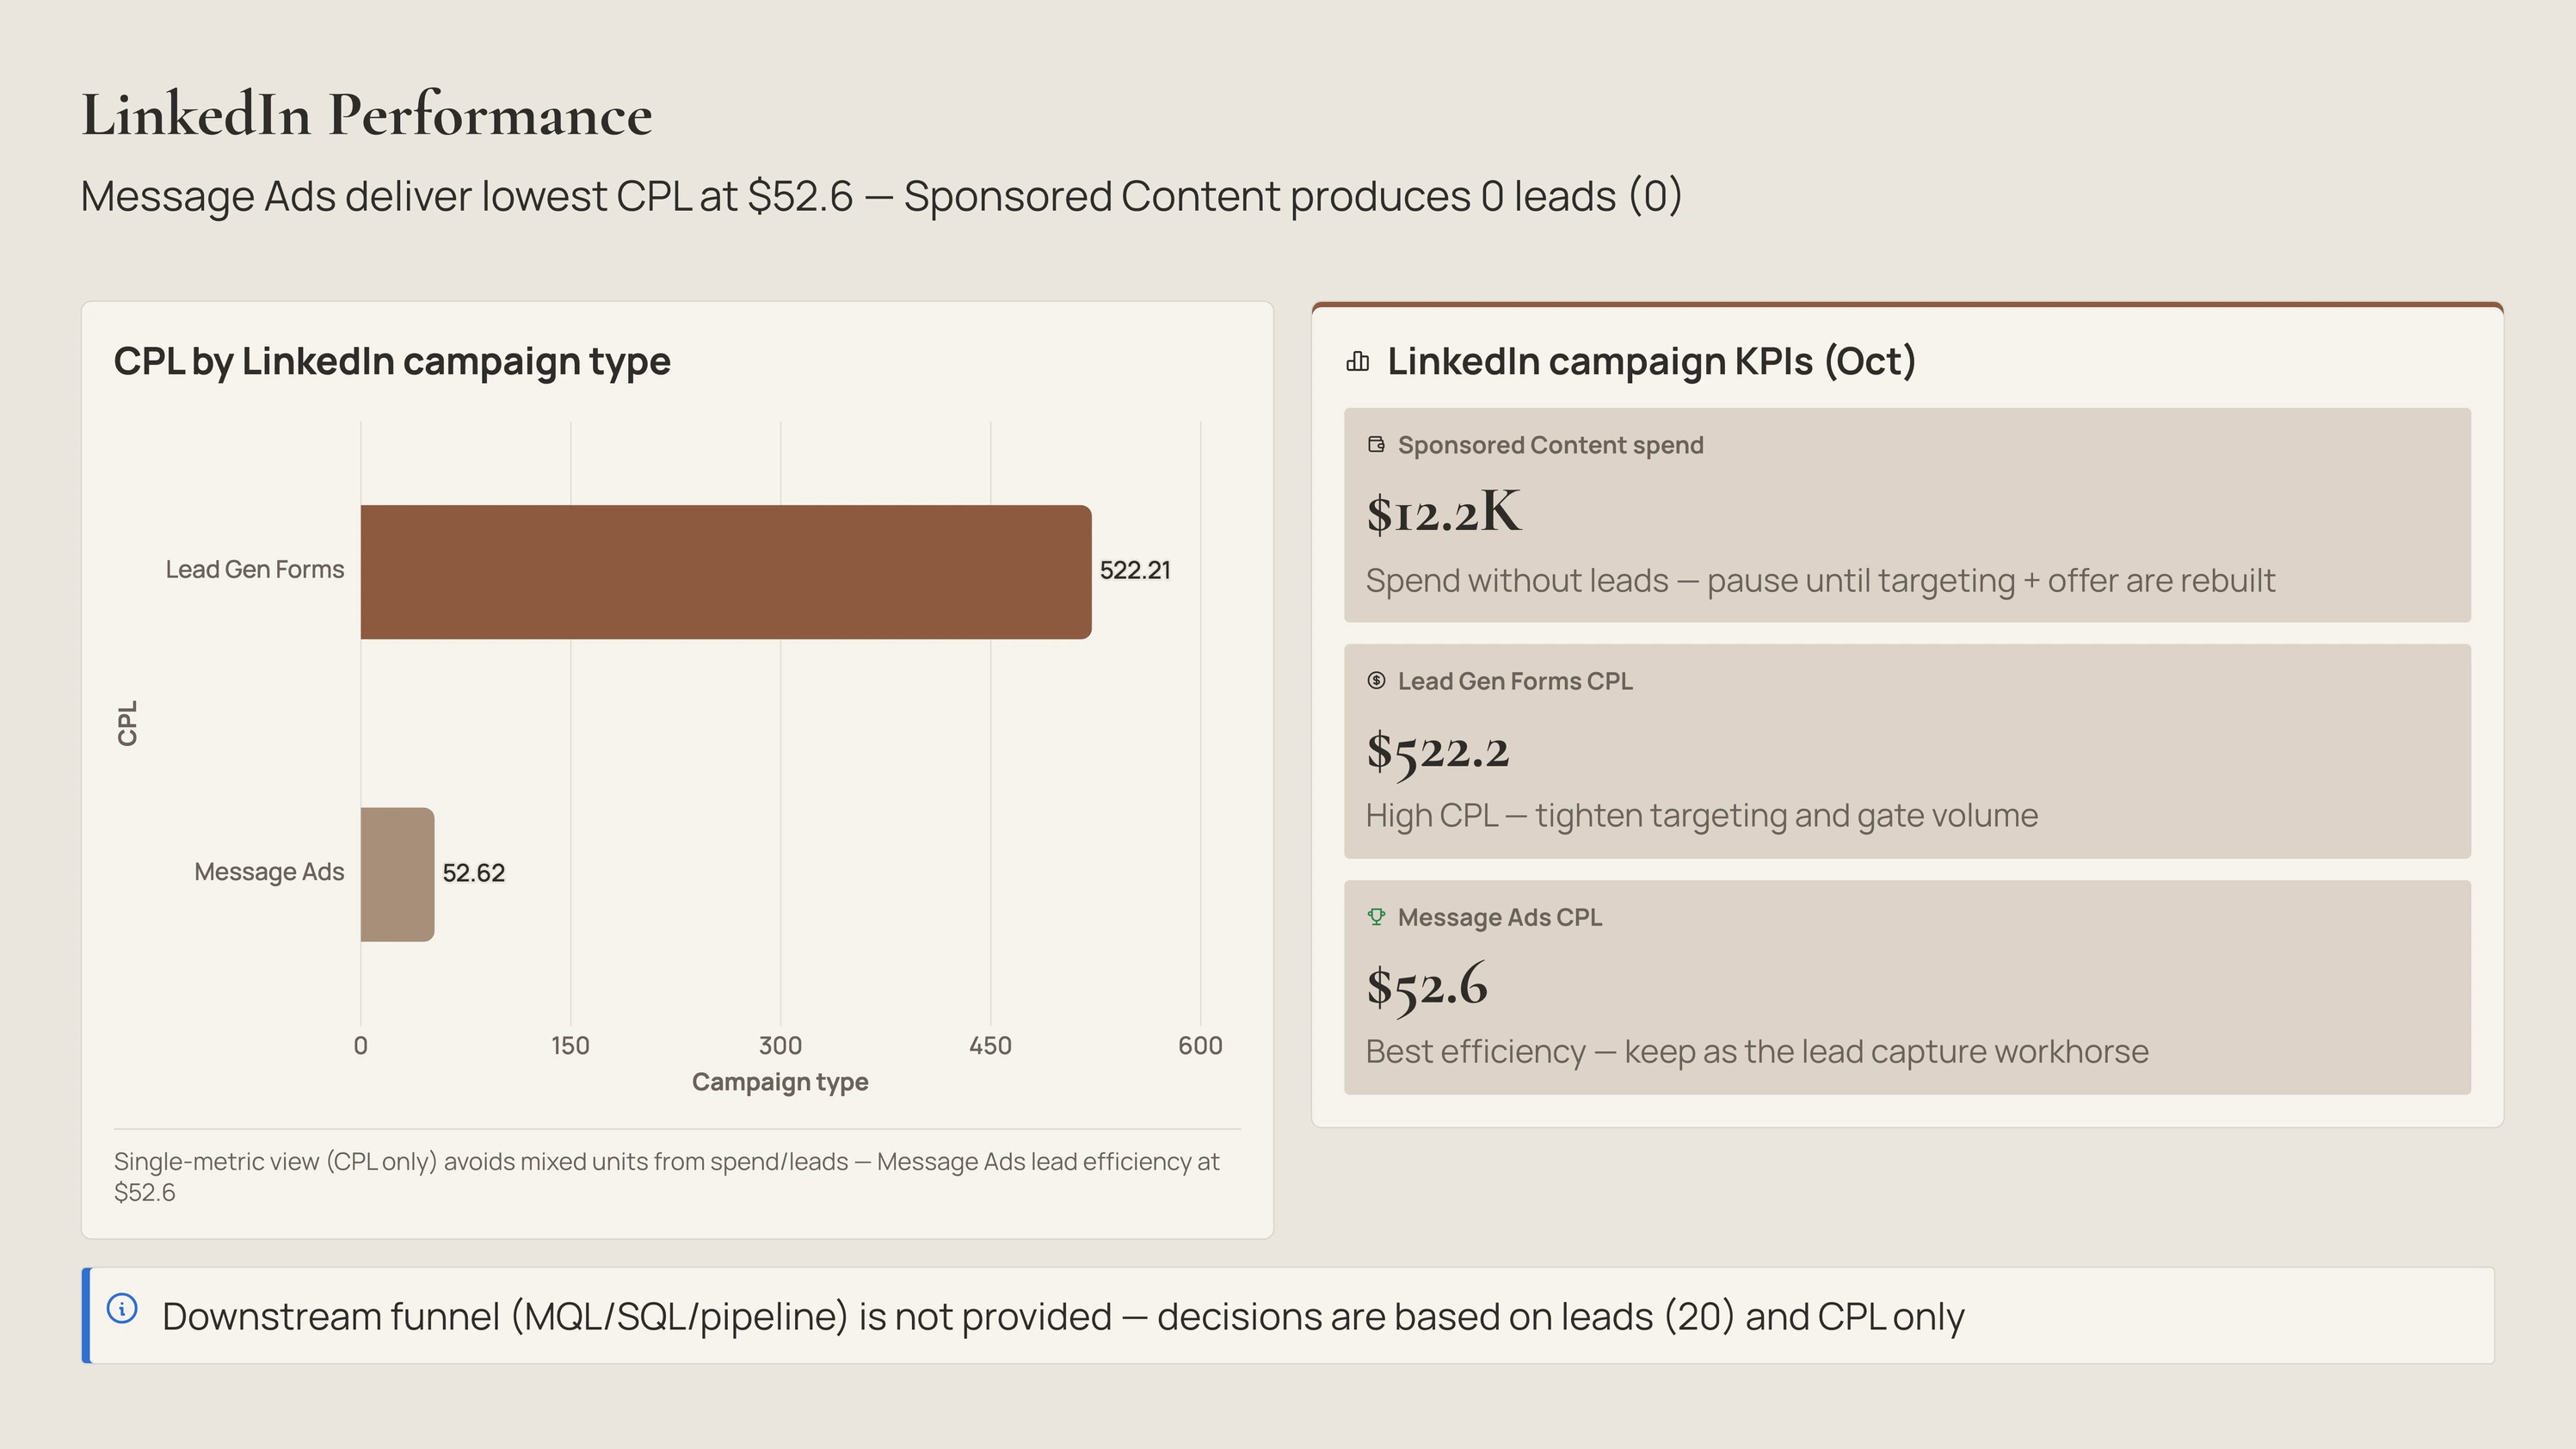
Sponsored Content burned $12.2K for 0 leads while Message Ads delivered the cheapest leads at $52.6 — so Coreworks flags the wasted spend and the channel worth keeping.

Creates a "pause this until it's fixed" callout, keeping Message Ads as the one to lean on.

Google Brand vs Non-Brand slide
Signal

Coreworks splits each channel into its parts and compares return.

Inside Google, branded returns 17.63 versus just 1.78 for non-brand, so Coreworks concludes brand is doing the work while weak non-brand (at $67.8 per result) drags the average down.

Creates a "protect brand, tighten non-brand" comparison, suggesting weak non-brand spend move into top searches.

Meta Performance slide
Risk

Coreworks ranks every audience on cost and return together.

Retargeting leads at 3.30 return / $39.9 while Broad is both the priciest and weakest at $124.1 and 1.05, so Coreworks singles Broad out as the one to cut.

Creates a cost-and-return chart, with a "scale retargeting, tighten or pause Broad" message.

Executive Summary slide
Trend

Coreworks compares actual spend to plan, then weighs it against return.

Spend came in about $1M under the $1.1M plan at a healthy 2.29 return, so Coreworks concludes there's unused budget the winners could absorb.

Creates a "scale the winners" summary, naming Google as the strongest ($80.4K spend → $238.1K revenue at 2.96).

04THE NARRATIVE

How the story is
designed to land.

Slide order is the argument — here's
why each one sits where it does.

Slide order is the argument. Here's why each slide sits where it does — and how the deck moves the room from blended efficiency to channel decisions.

Slides 02–03

Frame, then headline.

The agenda sets the four review areas; the executive summary lands the five blended numbers (spend $117.6K, conversions, CPA $55.5, revenue $269.1K, ROAS 2.29) so the room agrees on the month before any channel debate.

Slide 04

Establish pacing first.

The cross-channel table shows actual vs planned spend and the variance, so every channel deep-dive that follows is read against plan, not in isolation.

Slides 05–08

Largest to smallest.

Google first (biggest spend and revenue), then Meta, then LinkedIn — and LinkedIn carries an explicit definition note (leads, not purchases) so its CPL isn't misread against ROAS channels.

Slide 09

Caveat the funnel.

Impressions→clicks are shown as a proxy funnel with the downstream gap stated, keeping the deck honest about what the data can and can't prove.

Slide 10

Close on creative, not analysis.

The creative roundup turns analysis into the next production brief — what's resonating, and the format gaps to fill — so the meeting exits with the next sprint already scoped.

05EARLY USERS

Channel reviews that used to take a day. Now they take an upload.

Real teams, real spend — same
template.

★★★★★

"Pulling all channels into one view used to be a half-day of work. Now it's done with one upload"

SM
Sofia MarchettiHead of Growth · DTC
★★★★★

"The deck caught $12K of LinkedIn spend that produced zero leads. That callout alone paid for the month."

JO
James OkoroPaid Media Lead · B2B SaaS
★★★★★

"Every number traces back to a row in the export. When finance asks where blended ROAS came from, I can show them in one click."

HL
Hannah LeeMarketing Director · Marketplace

— ready when you are —

Build your own
Paid Media Review Deck

Use the same prompt, upload your ad-platform exports, and make your own decision-ready review.

Start for free

No credit card needed · Make a similar deck in 5 minutes