Sales · pipeline & forecast review

Your quarterly revenue review, in one prompt.

Upload your CRM and quota data. Get a ready-to-present review of what you closed, where it came from, and whether next quarter's pipeline can keep up. All in minutes.

No credit card needed · Make a similar deck in 5 minutes

Coreworks
Q1 2026 Revenue Review
Generated in 7 min
3-4
iterations
per presentation
3
data sources
combined
~7min
build time
with coreworks
6hrs
saved
each cycle
01THE DATA

Start with
what you already have.

Drop in your real exports,
no setup required.

CRM Deals table preview
Showing 4 of 84 rows · 01_Opportunities.csv

Which fields become which slide

closed won+quota

Executive Summaryhow you did vs plan

segment+actuals vs quota

Enterprise Dealswhere the win came from

AE name+segment+attainment

Top & Bottom AEswho's behind

coverage by segmentvs3.0x target

Q2 Coveragenext quarter's risk

commit

Executive Summaryforecast vs reality

[ 02 ]THE PROMPT

One line does the
heavy lifting.

Hover each orange chip to see what
that part of the prompt does.

The prompt tells Coreworks who this review is for, what to lead with, and how to frame the quarter. Here's what each part is doing.

Prompt used

Build a covering what we closed, the segment mix, and Q2 pipeline. It's for the , keep it high-level, focused on whether the quarter can repeat. , since . (AE-015 at 94%) and . Keep the tone direct.

03THE INSIGHTS

It reads your data
before it builds a slide.

Each thing it spots
shapes one slide.

Coreworks looks over your combined data first. Here's what it flags, and what each flag turns into.

Segment Q1 Results slide
Risk

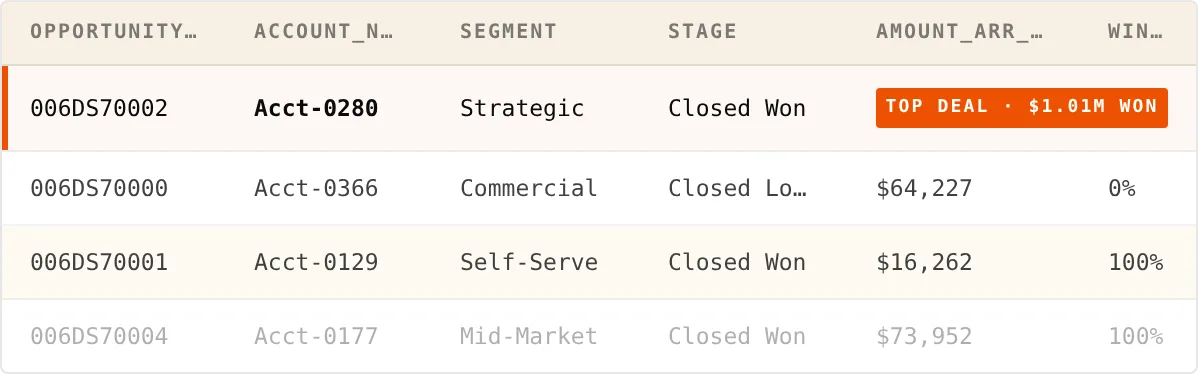
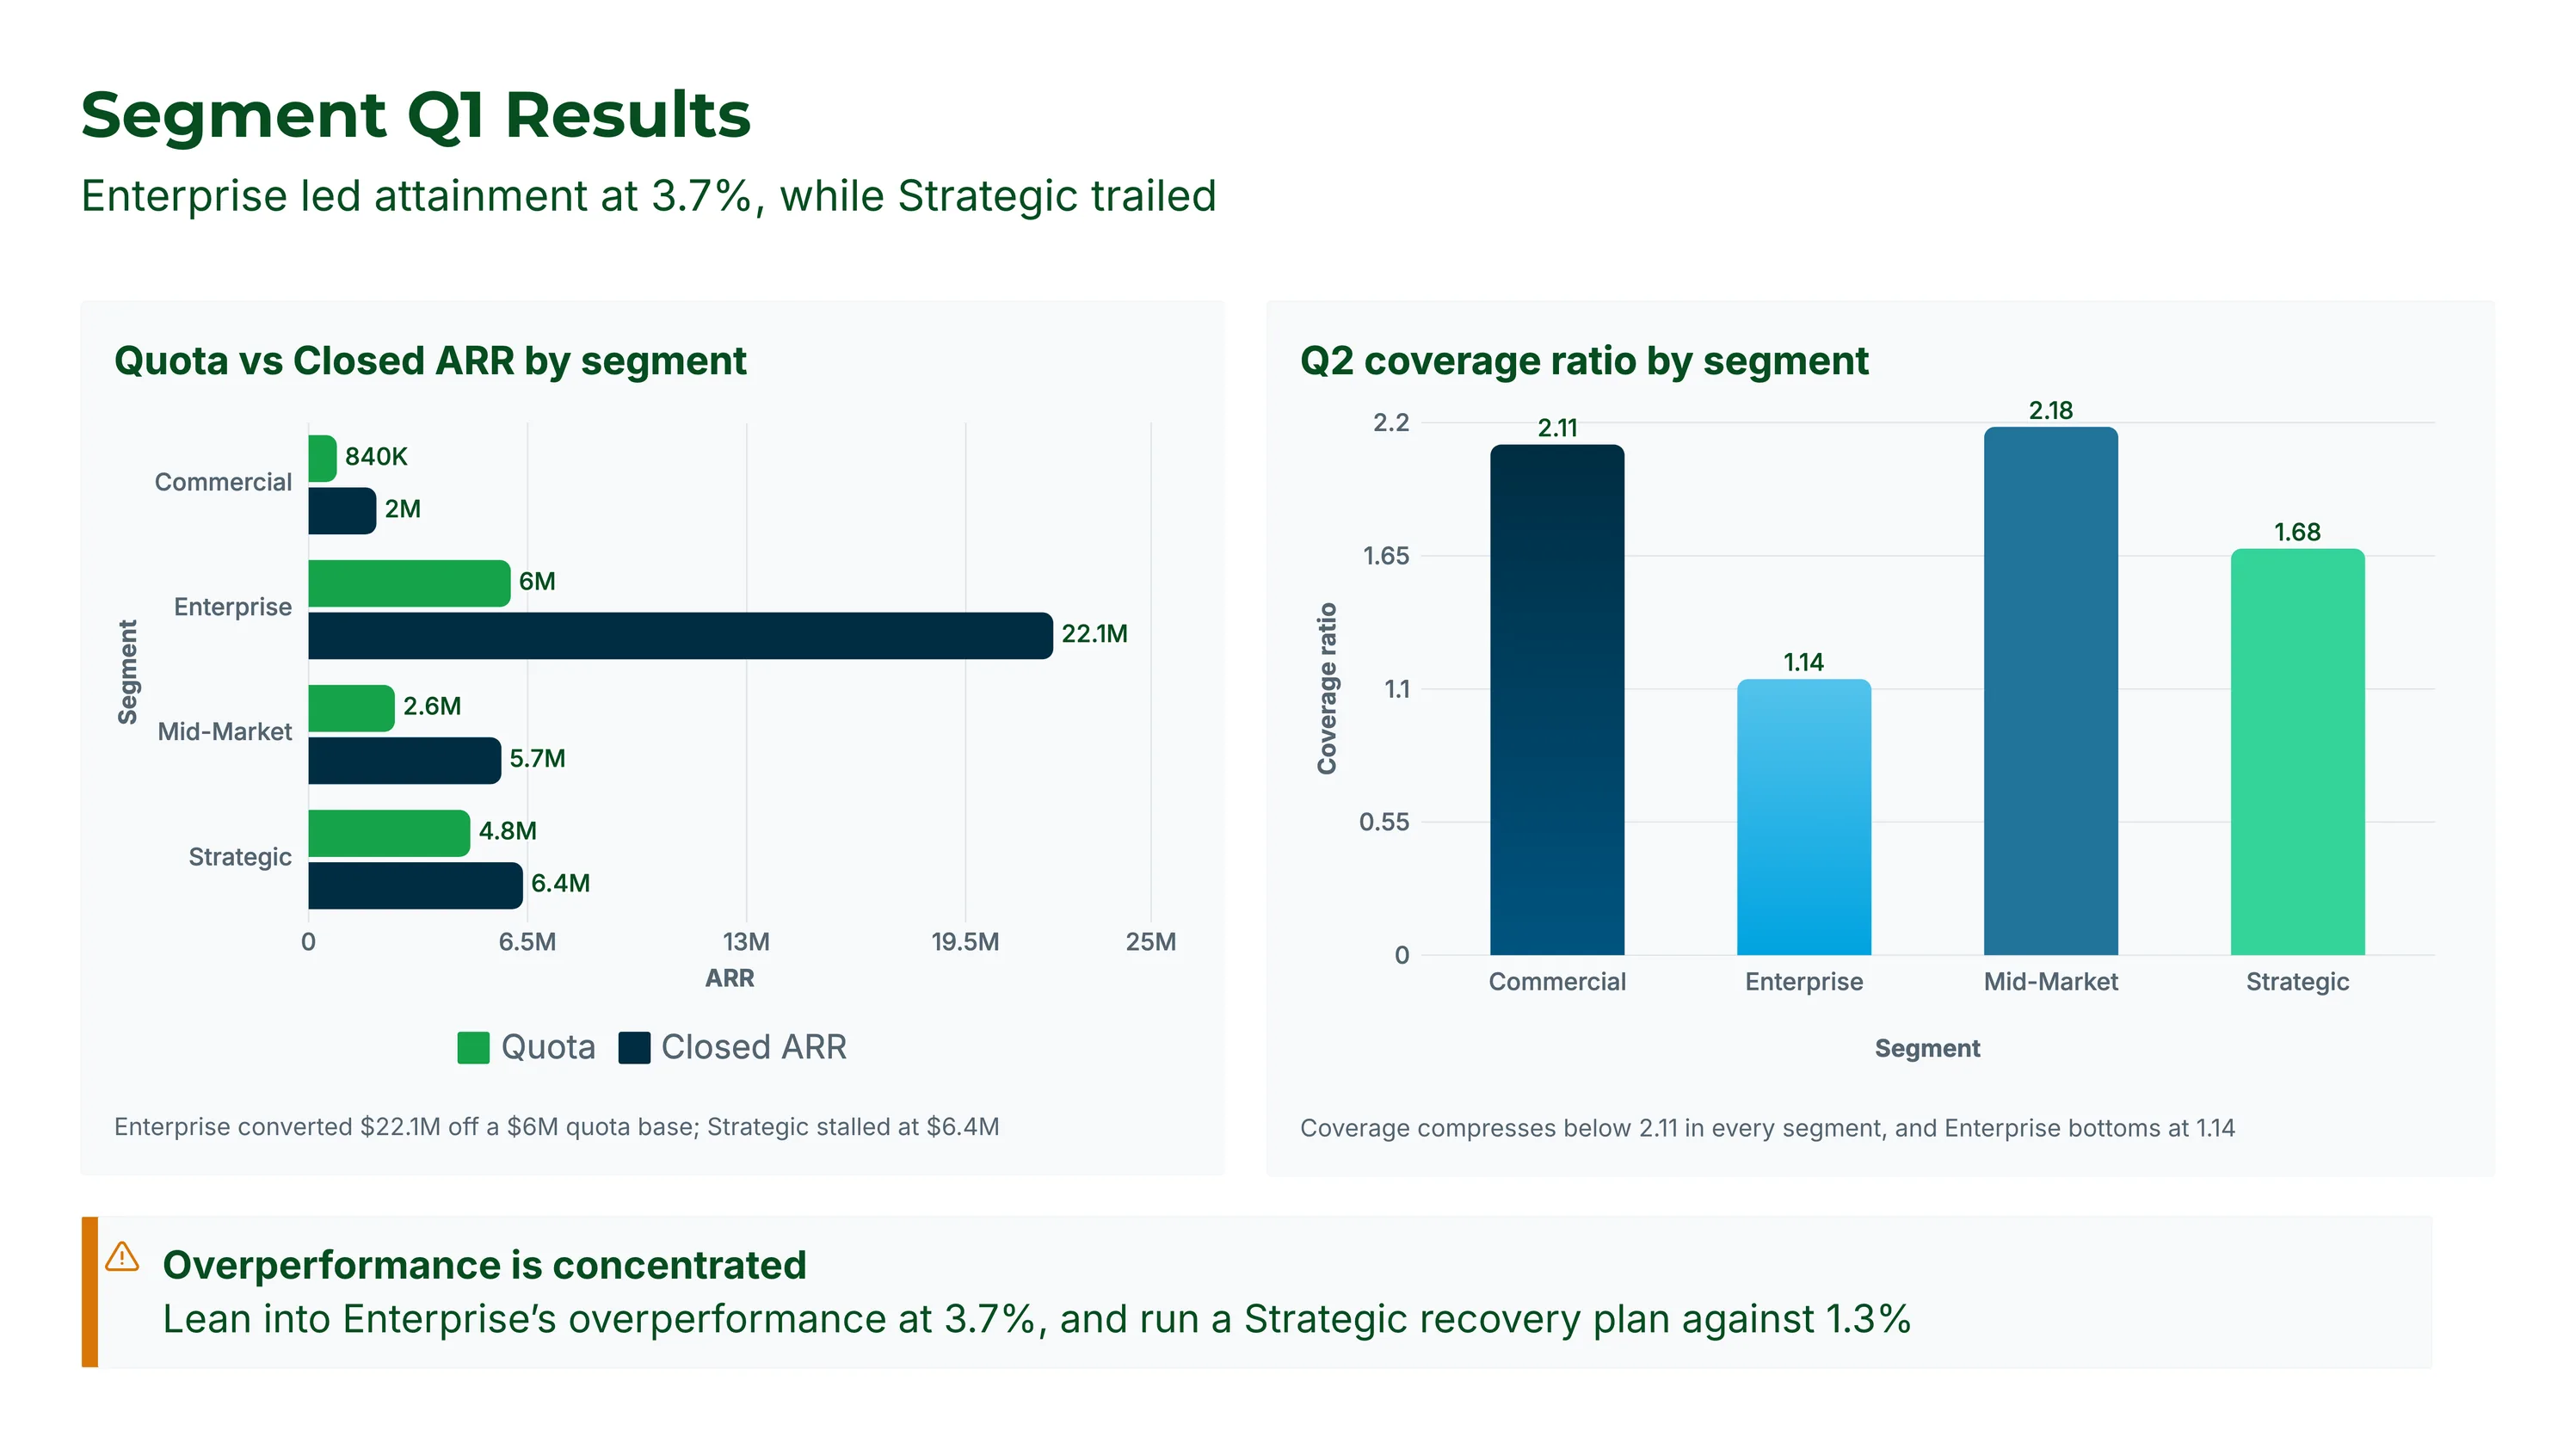
Coreworks weighs each segment's closed ARR against its quota.

Enterprise converted $22.1M off a $6M quota while every other segment landed near plan, so Coreworks concludes the $36.6M quarter leaned on one segment and may not repeat.

Creates a segment chart with a "concentrated overperformance" callout.

Underperforming AE Callouts slide
Anomaly

Coreworks ranks every rep's attainment against the team.

Aisha leads at 3.8% while four reps, including Tomas Wagner and Sasha Petrov, sit near 1.2%, so Coreworks flags the gap as a coaching problem, not a market one.

Creates an underperforming-AE table, ranked by attainment, so the reps to coach are named without it reading as an attack.

Stage Friction and Q2 Risk slide
Risk

Coreworks finds where ARR is stalling by sales stage.

Discover, Negotiate, and Procurement hold $41.7M, $27M, and $29.5M of stalled ARR, so Coreworks flags clearing that late-stage friction as what protects Q2 execution.

Creates a stalled-ARR-by-stage chart with a clear "clear Discover first" message heading into Q2.

Forecast Accuracy Trend slide
Trend

Coreworks checks the weekly commit against what actually closed.

Commit accuracy ran at 11.7% while actuals reached $36M, so Coreworks concludes the forecast badly understated reality, a discipline gap hiding behind a strong quarter.

Creates a forecast-credibility note: reset commit accuracy before leaning on the 2.40 Q2 coverage number.

04THE NARRATIVE

How the story is
designed to land.

The order
is the argument.

The prompt told Coreworks to start with the win, then turn to risk. Here's why that order works.

Slides 02–03

Start with the scorecard.

Lead with the headline numbers, $14.4M quota, $36.6M closed, 2.5x attainment, so the room knows the quarter landed ahead before any detail.

Slide 04

Show where the win came from.

A big number means less until you show it leaned on Enterprise — $22.1M off a $6M quota. That sets up the “can it repeat?” question.

Slides 05–06

Name the people story.

Top AEs first (Aisha at 3.8%), then the reps behind plan, so coaching targets are named without it feeling like an attack.

Slides 07–09

Turn to next quarter.

Forecast accuracy at 11.7% and $41.7M stalled in Discover point the deck forward: tighten the signal and clear late-stage friction before Q2.

Slide 11

End on decisions, not recap.

Every Q2 move has an owner and a deadline — close the $13M Enterprise gap, coach the named reps — so the deck closes on decisions, not a recap.

05EARLY USERS

Reviews that used to take a morning
now take an upload.

Real teams, real numbers,
same template.

★★★★★

"We used to rebuild this review from scratch every quarter. Now the scorecard, the segment mix, and the pipeline gap are just there, and every number ties back to the CRM."

DR
Daniel ReyesVP Revenue Operations · B2B SaaS
★★★★★

"It caught something we kept missing: one segment carried the whole quarter. Seeing that early changed how we planned Q2."

PN
Priya NairHead of Sales · Mid-Market SaaS
★★★★★

"Our pipeline coverage used to sit in a spreadsheet no one opened. Now it leads every review."

MW
Marcus WebbRevOps Analyst · Enterprise SaaS

— ready when you are —

Build your own
Pipeline Forecast Deck

Use the same prompt, upload your pipeline data, and get a ready-to-present review.

Start for free

No credit card needed · Make a similar deck in 5 minutes