Risk
Coreworks reconciles the CSM's renewal forecast against the product signals.
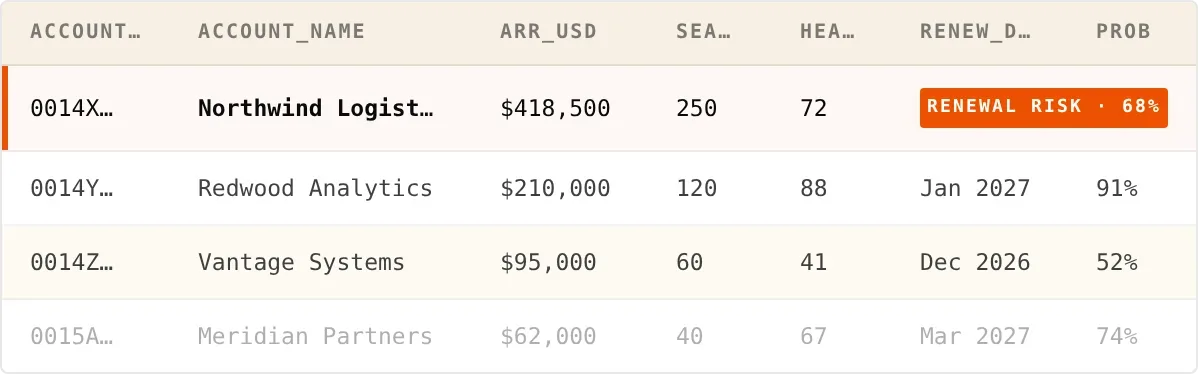
The CSM puts renewal at 68%, but health has dropped 11 points and two of three risk indicators are active so Coreworks concludes the real odds are lower than the forecast, with only 4 months left to act.
Creates a risk slide, opening with three active flags ranked by severity and the urgency language escalated throughout.